A Focus on Multi-Property Owners in Ontario

As of April 2022, just under 25% of all residential properties in Ontario are owned by multi-property owners.
In a previous edition of the Market Insight Report, we focused on the Ontario housing market and segmented all transfers of ownership in Ontario properties based on various buyer profiles: first-time homebuyer, movers, multi-property owners, life events and other. In this edition of the report, we will dive deeper into the multi-property owner segment to identify their buying behaviours and trends.
Multi-Property Owner Definition
The following two metrics are used to measure the activity of multi-property owners in this report:
1. Purchases by multi-property owners
- Purchase activities by those parties who already own another Ontario residential property at the time of the purchase1,2. This is the metric which was introduced in the previous edition of the Market Insight Report.
- Historical trending available from 2011 onwards
2. Properties owned by multi-property owners
- Measures the ownership of all Ontario residential properties by those who own multiple Ontario residential properties at a point in time. For the purpose of this analysis, this measure is based on ownership status as of April 30, 2022.
Note that in both metrics, the properties owned by multi-property owners could represent any combination of principal residence, recreational properties or investment properties.
Throughout this report, we will use the metric out of the two listed above that is best suited to illustrate the multi-property ownership profile of interest.
1For this metric, the existing properties held by the multi-property owners continue to be owned for at least 180 days after the property purchase of interest. Specifically, scenarios where a buyer purchase a new property and subsequently sold the sole existing property within 180 days would not be classified as a purchase by multi-property owner, but will instead be classified as a “mover” activity.
2For this metric, purchases by Corporations are excluded due to data limitation. Historically, purchases by Corporations comprised approximately 10% of Ontario Land Registry title transfer volumes, which would include both residential and non-residential properties.
Quantifying Multi-Property Ownership
 Dive Deeper Into the Data
 Since 2017, purchases of Ontario properties by multi-property owners have been on an increasing trend, reaching a peak in 2021 (Figure1). From 2017 to 2021, multi-property owners were the biggest buyer segment, accounting for 22% of purchases of Ontario residential properties. In 2021, this buyer group made the highest number of property purchases in Ontario at over 99,000. Data from Q1 2022 shows that this trend continued unabated with multi-property owners accounting for over 26% of purchases in the quarter. Note that registry transactions typically lag sales by 60-90 days in light of the closing period.
Purchase activities by this segment of buyers over the years culminated to an ownership rate of 24.6% of all Ontario residential properties as of April 30, 2022.
Multi-property owners account for 22% of Ontario residential property purchases.
Multi-Property Ownership Portfolio
As of April 30, 2022, over 53% of properties owned by multi-property owners are by those with only two properties in their portfolio, representing 13% of the Ontario property base (Figure 2). Approximately 29% of the properties owned by multiproperty owners have four or more properties in their portfolio, representing 7% of the Ontario property base.
The high proportion of multi-property owners who have only two properties in their portfolio suggest that most multi-property owners are seeking value from real estate in a passive way, as opposed to those who are leveraging real estate as an active business venture.
Around 53% of multi-property owners own two properties.
Regional Differentiations
Figure 3 Ownership by multi-property owners by region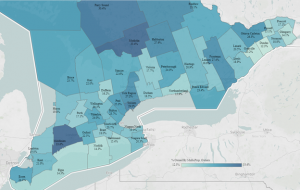
As of April 30, 2022, the region3 with the highest proportion of housing stock owned by multi-property owners is Middlesex, representing the London area, at 33.6% (Figure 3). Not surprisingly, Muskoka follows in second place at 33.4% as a popular cottage getaway. The region of Rainy River, at the Minnesota border, takes third place at 32.1%.
In Ontario, of the properties owned by multi-property owners, over 70% are owned by those who have all their property holdings in the same region. For example, this represents owners who have five properties, all in Toronto, or two properties, both in Ottawa. This points to the likelihood of investment properties close to a principal residence for ease of maintenance or purchases for related parties (such as children) for convenience and connection.
Across Ontario, of the properties owned by multi-property owners, 72% are non-condo properties and 28% are condo properties.
As of April 30, 2022 33.6% of residential properties in Middlesex are owned by multi-property owners
Regional Spotlight: Toronto
As of April 30, 2022, 29.0% of the housing stock in Toronto are owned by multi-property owners (Figure 3). Of those properties, 53% are owned by those who have all of their property holdings in Toronto (Figure 4). This would represent, for example, a party who owns three properties in Ontario, and all of which are located in Toronto, whether they represent principal residence or investment properties. Another 14.3% are by those who also own properties in York Region, 10.5% by those who own properties in the rest of the Greater Toronto Area (ie. Peel, Halton and Durham), and another 21.6% by those who also own properties outside of GTA. These observations appear to affirm the appeal of Toronto housing for both locals and those further away.
Of the Toronto housing stock owned by multi-property owners, 59% are condos and the rest are non-condos.
As of April 30, 2022, 29% of residential properties in Toronto are owned by multi-property owners.
Regional Spotlight: Muskoka
Muskoka has a higher proportion of housing stock owned by multi-property owners, relative to other regions, at 33.4% (Figure 3). Of those properties, 37.2% are owned by those who have all of their property holdings in Muskoka (Figure 5). Another 16.6% are by owners who also own properties in Toronto, and 14.1% from the other GTA regions of Peel, Halton, Durham and York.
Regional Spotlight: Waterloo
In Waterloo, 24% of the housing stock are owned by multi-property owners (Figure 3). Of those properties, almost 52% are owned by those who have all of their property holdings in Waterloo (Figure 6). Another 12.8% of those properties are owned by parties who have other properties in the GTA, followed by 36% by parties who own properties in other parts of Ontario. The diverse ownership base likely demonstrates the perceived value of real estate in Waterloo, which, as a university town, has great rental income potential.
Of the Waterloo properties owned by multi-property owners, 33% are condo properties.
The above regional analysis can also be performed at the municipality or FSA level if additional granularity is of interest. Chat with the Data Science Lab to learn how our customizable data can meet your needs.
Multi-Property Owner Transaction History
Profiling the transaction history of multi-property owners may help to sub-categorize this segment into the speculative buyers versus those who are looking for long-term value.
To do so, we look at the property purchases by multi-property owners to understand, at the time of the purchase in question, the number of properties previously sold by these parties since 2000 (when this data first became available). For example, for a property purchased in 2018 by a multi-property owner, we look at the number of properties held and sold by this owner between 2000 and immediately prior to the purchase date in 2018.
Since 2017, a consistent 42% of these multi-property owners have not sold another property between 2000 and the time of the multi-property purchase in question. Another 27% have previously sold one property at the time of the multi-property purchase, and 14% have sold two. This leaves 17% of multi-property purchases tied to owners who have sold three or more properties prior to the current purchase, which would translate to almost 4% of annual residential purchases in Ontario.
Since 2017, 42% of multi-property owners have not sold another property between 2000 and the time of the multi-property purchase in question.
The data suggests that those who have sold three or more properties may be indicative of multi-property purchases that are more short-term in nature. Figure 8 demonstrates the average turnover of the properties owned by multi-property owners who have sold three or more properties prior to the current purchase. he holding period progressively gets shorter as the number of properties sold increases, which confirms that the frequency of historical sales by multi-property owners is a good proxy for whether the property purchases by these buyers are likely held for short-term gain or long-term potential.
The holding period progressively gets shorter as the number of properties sold increases, which confirms that the frequency of historical sales by multi-property owners is a good proxy for whether the property purchases by these buyers are likely held for short-term gain or long-term potential.
This data suggests that the majority of multi-property owners are purchasing for long-term holding and value, with a small portion demonstrating higher rates of turnover and shorter holding periods in their property portfolio that is suggestive of speculative activity.
Data suggests that the majority of multi-property owners are purchasing for long-term holding and value.
Demographic Profile of Multi-Property Owners
Figure 9 Average age of multi-property buyers at the time of the purchase, based on purchase activity from 2017 to 2021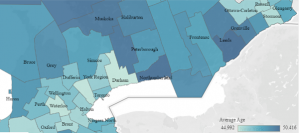
Over the last five years, the average age of multi-property owners at the time of the purchase has been fairly consistent at a range between 44 and 51 years old, regardless of the number of multi-properties in the portfolio. The average age also does not vary much based on the location of the properties.
The average age of multi-property owners in Ontario is between 44 and 51 .
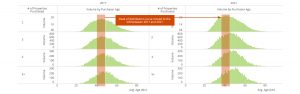
There is, however, a trend emerging whereby the multi-property buyer is getting younger, specifically in the two-property ownership group. The peak of the age distribution curve for the two-property owner in 2017 was 42 to 47 years old. By 2021, the peak of the curve has moved to 39 to 43 years old, at much higher volume levels.
Learn More
In future editions of the Market Insight Report, we will further explore the Multi-Property Owner segment to identify the number of parties involved in the purchase as well as their financing choices.
If you need more information about the data presented in this report, the Teranet Data Science Lab can help you dig deeper. Our team will work closely with you to answer your questions with insights from our proprietary databases.
Contact Teranet if you’d like to learn more.
Explore Our Insights


Want to recieve Teranet’s data spotlights and market insights regulary?
Sign up to be notified as soon as they’re released