A Review of Ontario's Housing Market in 2023

2023 was a slow year for Ontario’s real estate market, with record low home sales due in part by a number of interest rate increases since early 2022. In this report, we’ll dive deeper into data from 2023 and wrap up the year by reviewing trends and behaviours amongst Ontario’s home buyer segments.
In exploring trends by buyer segment, Teranet classifies buyers into the following categories:
- Movers: This category of buyers moved from one property in Ontario to another. They have sold their sole, existing property and purchased another property within a period of time.
- Multi-property owners: Property purchases by buyers who, at the time of the purchase, also own other properties in Ontario. The properties purchased by this group of buyers could represent a principal residence, an investment property, or a recreation property.
- First-time homebuyers: Property purchases by buyers who claimed the Ontario land transfer tax exemption for first-time homebuyers. To qualify for this exemption, the buyer(s) must not have purchased property anywhere in the world.
- Life event: Transfer of ownership between related parties for nominal value. These transactions could be due to marriage, divorce, or transfer between generations.
- Other: All other buyers. This could include buyers from outside of Ontario or Canada, or re-entry into the property market after an extended absence.
Overview of Ontario's buyer segments
 Dive Deeper Into the Data
 This report will begin with an overview of activity amongst all buyer segments in Ontario from 2011 to 2023. Multi-property owners have significantly increased their representation to almost a quarter of the market in recent years, accounting for 25.2% of all property transactions at its peak in 2022 before settling down to 23.7% in 2023. Since 2011, first-time homebuyers have consistently represented 20%-25% of the purchasing market. Similarly, life event transactions have remained fairly stable across time, but vary as a percentage of total transactions from 17.6% in 2011 to 21.3% in 2023. While there were many reports about the activity of movers during the pandemic, they have consistently remained one of the smallest (and in some years the smallest) buyer segments, with a significant drop in transaction activity in both 2022 and 2023 as interest rates rose.
Multi-property owners accounted for 23.7% of all residential property transactions in 2023
Since 2011, condo property purchases (Figure 2A) have been dominated by the first-time homebuyer and multi-property owner buyer segments, accounting for 28% and 30% respectively in 2023. This trend may be due to the relatively lower prices of condos being more attractive to these buyer segments. On the other hand, non-condo purchases have been more balanced between all buyer segments within a fairly small range of 15.4% (purchased by the mover segment) to 24.5% (purchased by the life event segment) in 2023.
First-time homebuyers accounted for 29.2% of condo purchases in 2023.
Regional spotlights
Toronto: Urban Centre
Since 2018, purchase transactions in Toronto have been dominated by first-time homebuyers and multi-property owners at about 25% and above. Despite media reports of movement in and out of the urban city centre during the pandemic, the mover buyer segment accounts for less than 11% of all purchase transactions in Toronto.
Peel and York Regions: Suburbs
While both Peel and York regions are classified as suburban, they show different trends amongst buyer segments. Peel has more first-time homebuyer activity, and higher-than-average life event transaction activity. Meanwhile, in York, there is a high ratio of multi-property owner purchase activity with a more balanced mix of the other segments.
London: University Town
London, as a university town, has high demand for student and faculty housing, in addition to a fair-sized city that attracts first-time homebuyers and families, that makes it a fairly balanced market amongst all five buyer segments between 2018 and 2023.
Muskoka: Cottage Country
Muskoka has a higher than average percentage of life event and multi-property owner transactions. This is aligned with the expectation that many cottage properties are passed down through generations and/or are recreational or investment properties.
Average purchase values
We have observed that Ontario’s buyer segments make different pricing decisions amidst the market’s overall escalation. In 2011, most buyer segments purchased in a fairly tight price range (Figure 4A). While movers continue to spend the most and first-time homebuyers the least, the price range has widened over time from $114,000 to $239,000 by 2023. The price appreciation in movers’ purchases equates to a Compound Annual Growth Rate (CAGR) of 7% over the course of 2011 to 2023, and 7.2% for first-time homebuyers. When we look at the average purchase value of Toronto non-condo properties amongst the buyer segments (Figure 4B), we can see that the price gap between groups has also widened significantly over time. Movers and the other buyer segment are willing to pay the most, followed closely by multi-property owners. First-time homebuyers spend the least, but they experienced the most significant price appreciation during the period at a CAGR of 8.3%, and in 2023, paid 2.6 times more than 2011.
Parties purchasing together
In recent years, trends relating to the number of parties registered on title have reflected the state of affordability in the real estate market. In 2016, following the introduction of the mortgage stress test, a period of decline in solo transactions and a corresponding increase of two-party transactions ensued. Historically, less than 5% of transactions have been made by parties of 3 and more, although we can observe a slight increase in these groups over time to just under 8% in 2023. These may be indications that individuals are increasingly having to pool funds and credit together for home ownership.
In recent years there has been a slight increase in transactions made by 3 parties or more.
To assess the magnitude of multi-generation purchases in Ontario, we measured the maximum age gap between parties in multi-party purchases. The vast majority of multi-party transactions are between parties within 20 years of age. There is a small, but growing, portion of transactions between parties greater than 20 years, which may be indicative of multi-generation purchases, a phenomenon that is more pronounced and growing in Toronto versus the rest of the province.
The majority of multi-party transactions are made between parties 20 within years of age.
Buyer segment spotlight: Multi-property owners
The majority of multi-property owners in Ontario have only two properties in their portfolios, suggestive of “passive” holdings instead of an active business venture for the purpose of income generation. While multi-property owners are continuing to make purchases, many portfolios have shrunk in size since April 2022. Multi-property owners with more than 11 properties accounted for 13% of all multi-property owner holdings in April 2022, but that has since decreased to 7.6% by the end of 2023. This observation may be indicative of profitability on investment holdings against a backdrop of rising rates since early 2022.
The number of multi-property owners with more than 11 properties decreased from 13% in April 2022 to 7.6% by the end of 2023.
Buyer segment spotlight: First-time homebuyers
In analyzing 2013 to 2023 data on the ages of first-time homebuyers at the time of purchase, we can observe that they are entering the housing market later in life, potentially another indicator of affordability challenges in Ontario. In 2013, 50% of first-time homebuyer transactions came from those aged 35 and younger. By 2018, 50% of first-time homebuyer transactions came from those 38 and younger, and by 2023, it has increased to 39 years of age.
From 2013 to 2023 the age of the majority of first-time homebuyers has increased
Buyer segment spotlight: Movers
Since 2011, the vast majority of the mover segment were those moving within the same region in Ontario, however this segment has been shrinking over time, from 70% to just under 60% by 2023. Those who moved from outside of the GTA to another area outside of the GTA has doubled in the last 10 years. Another small but growing segment were the movers that migrated from the GTA to outside of the GTA, from 6.5% to 11.1% of total Ontario mover activity by 2023. Its growth was particularly pronounced during the Covid-19 pandemic, where it peaked at 12.7% of total Ontario mover activities. And despite some headlines of urbanites who left the city during the pandemic and moving back as we return to normal, the portion of those moving from outside of the GTA to the GTA remain a very small segment at 2% and did not significantly increase post-pandemic.
The number of Movers moving within the same region of Ontario has shrunk from 70% in 2011 to under 60% by 2023.
The migration patterns that we have observed since 2011 correlates highly with the location of new housing stock across the province. Over time there has been a declining proportion of new homes within the GTA, with a significant decline in York and Peel regions. On the other hand, the Simcoe and Waterloo regions have seen an increase in new housing stock.
Connect with a Teranet account manager today to learn about our custom data offerings.
Overview of sellers in Ontario

In this section of the report we will shift our focus from purchasing trends to selling behaviour in Ontario. Within the past year the sentiment of uncertainty amongst Canadians with regards to the real estate market has been widely discussed, which appears to be evident in the length of holding periods. Holding period in this case is measured by the number of years the property was held at the point of sale. Ontario non-condo properties are held between 10 and 12 years on average, and as expected, condo properties are held for much shorter periods, between 6 and 8 years; both are increasing in length, albeit slightly, over the past 10 years.
Regionally, Toronto has one of the highest holding periods for non-condo properties in Ontario at 14.9 years for sales in the ten years to 2023, compared to surrounding regions of Peel at 9.2 years and York at 9 years. This observation may be indicative of Toronto homeowners’ preferences for urban and/or choices to upgrade existing home to meet changing needs.
Ontario non-condo properties are held between 10 and 12 years on average.
Since the series of rate increases beginning in Spring 2022 and carrying costs increasing correspondingly, accounts of distressed property sales were rampant. Through our data, we have observed a recent increase in the proportion of properties that were sold within one to three years of ownership. While this was only a slight uptick from 17.8% in 2021 to 19.6% of all sales in 2023, it may be an early indication of homeowner stress who purchased their properties at the price peak of 2021 and 2022.
In 2023 the number of properties sold within one to three years of ownership increased to 19.6%.
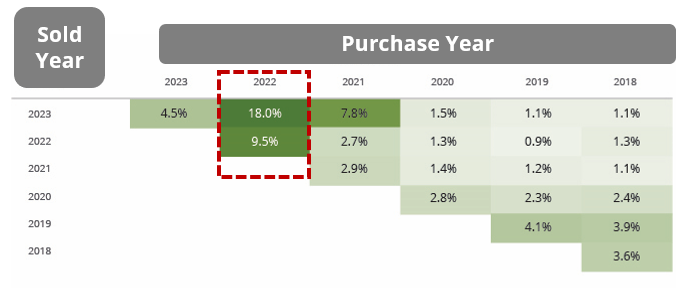
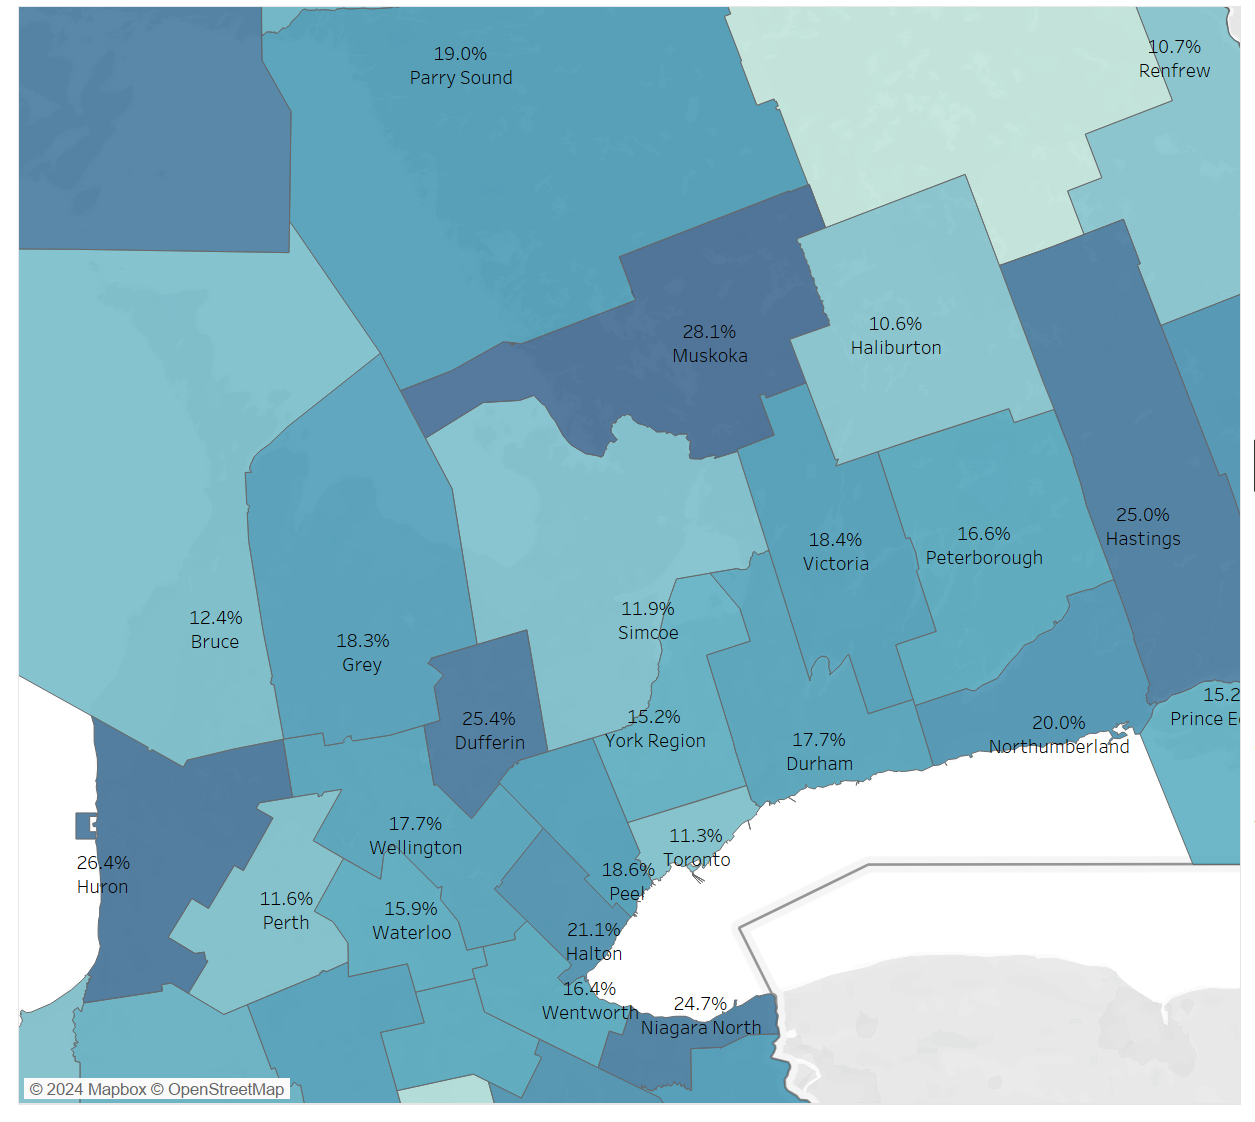
Another indication of market stress may be visible in the recent trend in which properties recently purchased and sold are incurring losses at much higher rates than historical averages. As an example, of Ontario properties purchased in 2022 and sold within the same year, 9.5% were sold at a loss; of properties purchased in 2022 and sold in 2023, 18% were sold at a loss, where the historical averages were closer to 2% to 4% (Figure 12A). When we look at this from a regional perspective (Figure 12B), of properties purchased in 2022 and sold by 2023, 11.3% of Toronto properties sold at a loss, faring better than most other regions, while Muskoka saw the highest rates of loss at 28.1%.
Of properties purchased in Toronto in 2022 and sold by 2023, 11.3% sold at a loss
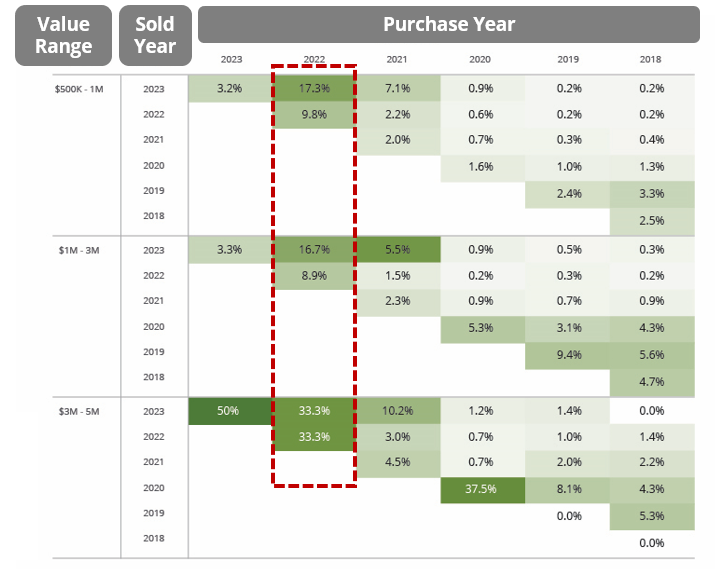
These elevated rates of loss were observed in properties purchased in 2022 and sold by 2023 across all price ranges. However, sales of properties priced $3 million to $5 million were twice as likely to have been sold at a loss than other price ranges.
Conclusion
In summary, we discern the following trends in the Ontario housing market using data from 2013 to 2023:
- Multi-property owners have been the dominant buyer segment in Ontario, accounting for a quarter of all transactions.
- First-time homebuyers faced tremendous headwinds in purchasing their first homes in Ontario, especially those looking for a non-condo property in Toronto. This is likely correlated with the delays in first-time homebuyers getting into the housing market.
- Ontario movers appear more inclined to move out of local areas, which may correspond to where new housing stock is being developed.
- Those who purchased in late 2021 and 2022 and subsequently sold these properties are doing so at a loss at elevated rates against historical trends.
These trends, coupled with the upcoming mortgage renewal cycles, may have a bilateral effect on one another. Teranet’s Data Analytics team will continue to monitor these trends and the behaviours of Ontario’s buyers and sellers to bring you new insights in future editions of the Market Insight Report.
If you need more information about the data presented in this report, the Teranet Data Science Lab can help you dig deeper. Our team will work closely with you to answer your questions with insights from our proprietary databases.
Connect with a Teranet account manager if you’d like to learn more.
Explore Our Insights


Want to recieve Teranet’s data spotlights and market insights regulary?
Sign up to be notified as soon as they’re released