An Overview of Ontario’s Housing Market in 2025


Ontario’s real estate market has recently experienced a few years of change. Entering 2025, the market had historically high transfer volumes, rapid price escalations and a belief that normalization would arrive once rates stabilised. Instead, the data in this report shows that the market did not experience a simple rebound, but a rearrangement by buyer type, property type and geography.
Transaction volumes remained well below historical norms across much of Ontario in 2025, which has had an impact for professionals across the real estate ecosystem. Deals continued to happen, but there were shifts in the profiles of the types of properties that were transferring and who was buying them. One of the most notable trends we uncover in this report is the shift in the number of transactions completed by multi-property owners and first-time homebuyers.
On the selling side, we also saw behaviour we haven’t seen at scale in Ontario before. Holding periods lengthened and properties purchased in late 2021 and 2022 that came back to market did so at unprecedented rates of loss.
Transfer Volume Overview
 Dive Deeper Into the Data
 Over the past decade, Ontario’s housing market has maintained a steady split between non-condo (75%) and condo (25%) transfer activity.
In 2024, we saw a noticeable shift where condo transactions peaked at 28% of total transfers, marking a cyclical high. By 2025, activity cooled and condo transactions eased by 3% year‑over‑year, reflecting affordability pressures and more cautious buyer behaviour. Meanwhile, non‑condo sales saw a 1% increase, pointing to the resilience of buyers who are motivated by long‑term housing needs rather than short‑term market movements.
Together, these trends tell a clear story: Ontario’s market remains stable, but demand is shifting toward practicality and affordability.
In 2025, condo transactions declined 3% year-over-year in Ontario.
When we narrow in on Toronto, the story sharpens. The city has long been condo‑dominant, with condos consistently making up around 60% of total property transactions over the past decade. That share climbed to a peak of 66% in 2024, marking a clear high point in the cycle.
But in 2025, the data reveals some notable volatility compared to the rest of Ontario, with condo transactions dropping about 8%. This change suggests a subtle but meaningful shift in buyer preferences. Elevated interest rates and increased carrying costs are encouraging some buyers to re‑evaluate value for space, while others are simply being priced out of the condo market’s condensed supply.
Toronto’s data highlights how urban markets adjust faster and more sharply than the broader province.
Toronto condo transactions dropped 8% year-over-year in 2025.
In 2024, we saw new‑build transfers reach an all‑time high across Toronto. That peak reflected the culmination of construction projects launched during the pandemic‑era boom when demand, population growth and development pipelines were all hitting their stride.
By 2025, however, new‑build activity declined by about 12%, signaling a return to more typical levels as that wave of completions eased and developers faced the reality of higher financing and construction costs.
Meanwhile, resale activity held relatively steady, dipping only 2% year‑over‑year. That resilience points to buyer demand helping to stabilize overall transaction levels even as new builds cooled.
New-build transaction volume declined 12% in Toronto in 2025.
Power of Sale Trends
Power of sale activity continued to increase in 2025, extending the strong growth trends seen over the past few years. While the volume still represents a small share of total transactions, the pace of growth is telling as it reflects the financial strain some homeowners are experiencing under prolonged higher interest rates and elevated living costs.
This trend may also indicate that more households are reaching the limits of their payment flexibility, particularly those renewing mortgages at significantly higher rates or carrying variable‑rate debt.
Overall, the rise in power of sale activity reminds us that market normalization doesn’t impact everyone equally. Even as overall sales stabilize, portions of the market are feeling sustained financial pressure. Monitoring this data helps us gauge early warning signals about credit health and housing stability across Ontario.
The number of power of sale transfers increased from 2,123 in 2024 to 2,979 in 2025.
Overview of Ontario Buyer Segments

Movers
This category of buyers moved from one property in Ontario to another. They have sold their sole, existing property and purchased another property within a period of time.

Multi-Property
Owners (MPOs)
Property purchases by buyers who, at the time of the purchase, also own other properties in Ontario. The properties purchased by this group of buyers could represent a principal residence, an investment property, or a recreation property.

First-Time
Homebuyers (FTHBs)
Property purchases by buyers who claimed the Ontario land transfer tax exemption for first-time homebuyers. To qualify for this exemption, the buyer must not have purchased property anywhere in the world.

Life Events
Transfer of ownership between related parties for nominal value. These transactions could be due to marriage, divorce, or transfer between generations.

Other
All other buyers. This could include buyers from outside of Ontario or Canada, or re-entry into the property market after an extended absence.
As we’ve seen, Ontario’s overall housing activity has been shaped by shifting affordability and financial pressure. To understand how those forces are playing out let’s look at what’s happening within different buyer segments.
Over the past year, Ontario’s buyer mix has shifted considerably. Multi‑property owners were the largest segment during the investment-driven peak of 2022, but this segment has experienced a sharp decline in market share, falling to third place. Rising interest rates and tougher lending conditions may have tempered this segment’s appetite, freeing up space for other buyer segments.
First‑time homebuyers have rebounded strongly, now leading market demand. This has been supported by modest price corrections and a slight improvement in affordability, helping new buyers enter the market after sitting on the sidelines through the high‑rate environment.
The life‑event segment has remained steady, but their share of total activity has increased because overall transaction levels have slowed.
Transfers by movers remain well below pre‑2022 levels. Higher borrowing costs have constrained mobility, and even with some rate easing, many owners remain “locked in” by the cost of carrying a new mortgage.
First-time homebuyers became the largest buyer segment in 2025.
Now that we’ve looked at how the composition of buyers has shifted overall, let’s dig a bit deeper into what those buyers are purchasing.
Even with their overall decline in market share, multi‑property owners continue to dominate the condo segment. Condos may remain the preferred option for this segment due to their lower price points and rental potential in urban centres.
In contrast, first‑time homebuyers are showing a clear upward trend in the non‑condo segment, now representing around 25% of all buyers, which is the highest share in the past decade.
Regional spotlights
This section of the report examines how buyer composition varies across a few of Ontario’s regions, highlighting the extent to which local dynamics shape overall market behaviour. The data confirms that Ontario does not operate as a single, unified housing market; instead, it comprises a set of distinct sub‑markets, each influenced by its own economic realities and affordability conditions.
Toronto and Peel Region continue to be dominated by first‑time buyers and multi‑property owners. This concentration reflects ongoing affordability challenges that constrain move‑up activity as well as the enduring presence of multi-property owners who remain active despite broader market headwinds. In these regions, the muted participation of movers underscores a population that is either financially locked‑in or constrained by the high cost of trading within the same market.
York Region displays a more balanced mix of buyers. Both movers and first‑time homebuyers represent a meaningful share of activity, pointing to a suburban market where households are still entering homeownership and moving within the region. Although activity has not returned to pre‑pandemic levels, the distribution reflects a more traditional suburban dynamic.
In Middlesex, the data shows a pronounced presence of multi‑property owners alongside strong participation from first‑time buyers. This pattern aligns with the region’s relative affordability and the influence of a stable, student‑driven rental market.
Muskoka stands apart as a distinct sub‑market driven largely by lifestyle‑motivated purchases. Buyer composition here is less tied to the traditional housing market. Instead, activity reflects wealth‑based decisions, second‑home ownership and recreational property demand. These dynamics position Muskoka differently from both urban and suburban regions, with unique sensitivities to broader economic cycles.
Average Purchase Values
When we look at the price point that the buyer segments are purchasing at, we can see that across Ontario, the average transfer values by buyer classification have remained broadly consistent over the past few years, suggesting that price corrections have largely stabilized.
Focusing on Toronto’s non-condo market, some distinctions stand out. First‑time homebuyers continue to transact at the lowest price points, and average purchase values for this group declined further in 2025. That mirrors the wider downward trend in non-condo prices, but it also shows that first-time homebuyers may be targeting more affordable sub‑markets or smaller properties.
Movers spent the most on average on Toronto non-condo properties in 2025.
Deep Dive on First-Time Homebuyers
In this section of the report, we’ll focus on the most active buyer segment in Ontario: first-time homebuyers. Their activity often signals confidence, affordability and accessibility within the broader market.
Our analysis of first‑time homebuyer behaviour will start with one key indicator: the average age at which Ontarians enter the housing market. This measure helps us understand not only buying power, but also the point in life when people are finally able to purchase their first home.
The data tells a clear story. In 2015, the median first‑time buyer age was 36. Just five years later, by 2020, it had increased to 38. Fast‑forward to 2025 when the average age reached a high of 40.
This steady upward trend shows that Ontarians are entering homeownership later than ever before, which is a direct reflection of ongoing affordability challenges, rising borrowing costs and the higher deposit thresholds now required to enter the market.
Essentially, what used to be an early‑career milestone has shifted deeper into mid‑career, as prospective buyers need more time to build savings or equity before taking that first step into the market.
Even with recent price moderation, this age trend highlights the affordability issues that continue to shape demand, delaying entry, but not diminishing aspirations.
The average age of a first-time homebuyer in 2025 was 40 years old.
To further understand buyer behaviour we’ll look at how many parties are purchasing together, focusing on first‑time homebuyers and multi‑property owners, and comparing condo and non‑condo transactions from 2011 to 2025. The number of names on title provides insight into how buyers are adapting to affordability pressures.
Starting with first‑time homebuyers, there has been a steady increase in transactions involving two or more purchasers, particularly in the non‑condo market. By 2025, nearly three‑quarters of non‑condo first‑time purchases involve two parties, and the share involving three or more parties has grown meaningfully, reaching close to 19%. This suggests that first‑time buyers are increasingly relying on dual incomes or broader household support to access ground‑oriented housing.
In the condo market, first‑time buyers also show a growing tendency to purchase together, though not to the same extent as non‑condos. Single‑party purchases have declined over time, while two‑party and multi‑party transactions have become more common, reinforcing the role of shared ownership as an affordability strategy, even at lower price points.
Across the board, we’re seeing declines in multi-property owner transfer volumes regardless of how ownership is structured, whether deals involve single buyers, pairs, or larger groups. Higher borrowing costs, tighter qualification criteria, and lower returns are impacting the entire buyer segment.
Even with these declines, most multi-property owner transactions continue to involve new, two‑party buyers. That pattern suggests partnerships, often spouses, family members, or small investor groups, remain the most common and accessible ownership model for entering or expanding in the investment market.
What’s particularly interesting is the emergence of a new group of solo multi-property owners, now accounting for roughly 30% of all new multi‑property purchases. This cohort reflects a growing segment of independent buyers, individuals potentially looking to diversify wealth, leverage equity, or seize opportunities in a softer market.
Deep Dive on Multi-Property Owners
As highlighted earlier in the report, multi-property owners have declined from the largest buyer group in Ontario in 2024 to the third largest group in 2025. In this section of the report, we’ll dig a bit deeper into their activity. In 2025, 55% of multi-property owners had two properties, followed by about 20% who have three properties, which suggests that the majority of this segment are “passive” owners as opposed to those who are leveraging their real estate portfolio for active income. Only 7.5% of multi-property owners own 10 or more properties.
Across both existing and new multi-property owners, two‑party purchases dominate transaction volume, indicating that shared ownership remains the most common way to participate in the market. Among new multi-property owners, two‑party buyers account for the largest share of purchases, reinforcing that entry into investment ownership increasingly requires pooled financial capacity.
At the same time, there is a notable emerging cohort of new, single‑party multi-property owners, representing roughly 20% of multi-property owner purchases. This suggests that while affordability pressures remain significant, a subset of buyers still has sufficient capital to enter the investment market independently.
Larger purchasing groups of three or more parties remain a small and declining share of multi-property owner activity, particularly among existing multi-property owners. This indicates that rising costs are not leading to widespread large‑group or institutional purchasing, but instead are encouraging small, more targeted purchases.
About 20% of multi-property purchases were made by single parties.
Among this cohort of new individual multi-property owners, property type preferences remain fairly balanced between condo and non‑condo, though there’s been a modest shift toward non‑condo properties compared to 2024. That movement suggests a growing appetite for larger homes, perhaps rental conversions or smaller secondary units, as buyers look for more flexibility and stability in returns.
From a geographic lens, the regional distribution has stayed relatively consistent year‑over‑year, but there’s been a slight pullback in Toronto alongside a small uptick in the York region. This could indicate that newer solo buyers are seeking opportunities just outside the downtown core, where price points and yields may be more balanced.
On the financing side, mortgaged multi-property owner purchases have risen slightly since 2024, signalling that leverage remains a key tool even for individual buyers, particularly as property costs remain high across most of the province.
What’s most notable, though, is the generational shift. Single‑buyer, mortgage‑free multi-property owner purchases among Baby Boomers have surged, climbing from 20% to 31%. That sharp increase points to older investors drawing on accumulated equity or liquid capital to expand portfolios without taking on new debt. Meanwhile, Gen X and Millennial multi-property owner activity has declined, underlining their greater sensitivity to affordability and financing conditions in today’s environment.
Overall, this profile shows a changing face of multi-property ownership in Ontario: one where experienced, equity‑rich individuals are sustaining activity, even as younger, more leveraged buyers step back.
28% of purchases by new, single multi-property owners were made without a mortgage.
While the profile of a new, single-party multi-property owner has changed since 2015, these changes have not been uniform. The most notable shift has been in property type, while financing behaviour and age remain relatively consistent over time.
Historically, new multi-property owners primarily entered the market through non‑condo properties. Since 2020, however, condo purchases have increased steadily, bringing the split between condos and non‑condos close to even by 2025. This reflects a meaningful change in the types of assets new multi-property owners are choosing.
In contrast, financing patterns have been remarkably stable since 2015. Mortgages continue to be used in roughly three‑quarters of new multi-property owner transactions, with only modest variation year-to-year. This suggests that leverage remains a core feature of how new solo multi‑property owners enter the market.
Similarly, the average age of new multi-property owners has changed only gradually. While there is a slight upward trend in recent years, the age profile overall has remained relatively stable, hovering in the low‑50s across the decade.
Overall, the data suggests that the pathway into multi‑property ownership has evolved primarily through what is being purchased, rather than who is buying or how purchases are financed.
Condo purchases by new, single multi-property owners rose from 38.6% of total volume in 2015 to 48.9% in 2025.
Deep Dive on Movers
Shifting our focus to movers gives us insight into how households are reshaping their living situations, whether that be upsizing, downsizing or relocating.
Within the mover segment, a clear pattern has emerged. Intra‑regional movers (those buying within the same city or region) continued to gain share in 2025, making them the only mover segment showing consistent growth over the past couple of years.
This trend underscores a more practical, localized approach to mobility. Many households may be adapting their housing to new life stages or household needs without staying far from existing jobs, schools, or community networks.
Overall, 2025’s mover data points to a consolidation of demand within communities, where convenience, stability and cost control are shaping decisions.
Overview of Ontario sellers
So far, we’ve looked at who’s buying and how they’re behaving. To round out the picture of Ontario’s housing ecosystem, we now turn to the sellers. To start to understand seller behaviour we’ll look at how long homeowners are holding onto their properties before selling.
Holding periods have steadily increased since 2021, signaling a decline in market liquidity as fewer properties are cycling through the resale market. Teranet measures this by analyzing the time between a homeowner’s purchase and their subsequent sale. Over the past decade, the trend has been clear across both property types.
This trend is consistent across regions, but it is most pronounced in Toronto and other high‑cost markets, where average holding periods have risen sharply. Condo holding periods have also increased, but remain shorter than non‑condos, reflecting greater turnover in that segment.
Longer holding periods suggest that owners are less willing or less able to sell, likely due to high replacement costs, affordability barriers, and locked‑in financing. As a result, fewer homes are cycling back into the market, which has implications for overall supply, market liquidity, and affordability over the longer term.
The key takeaway is that rising prices and higher costs are not only reshaping who buys, but also how long owners hold onto their homes, reinforcing supply constraints in already tight markets.
The holding period for Toronto non-condo properties reached a high of 17.7 years in 2025.
Avg. Holding Period – Condo
Avg. Holding Period – Non Condo
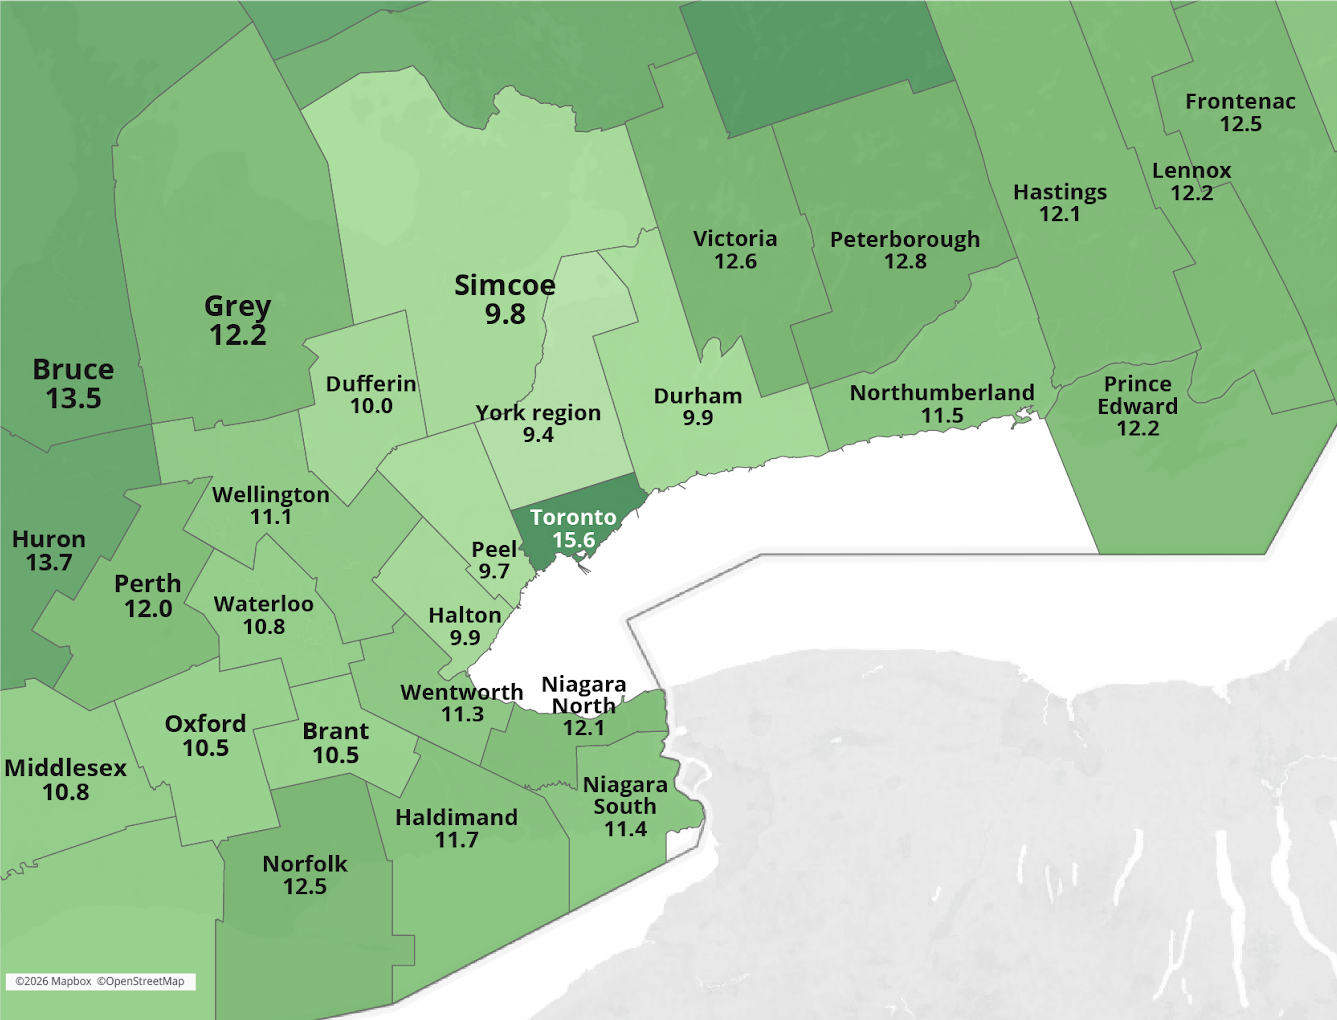
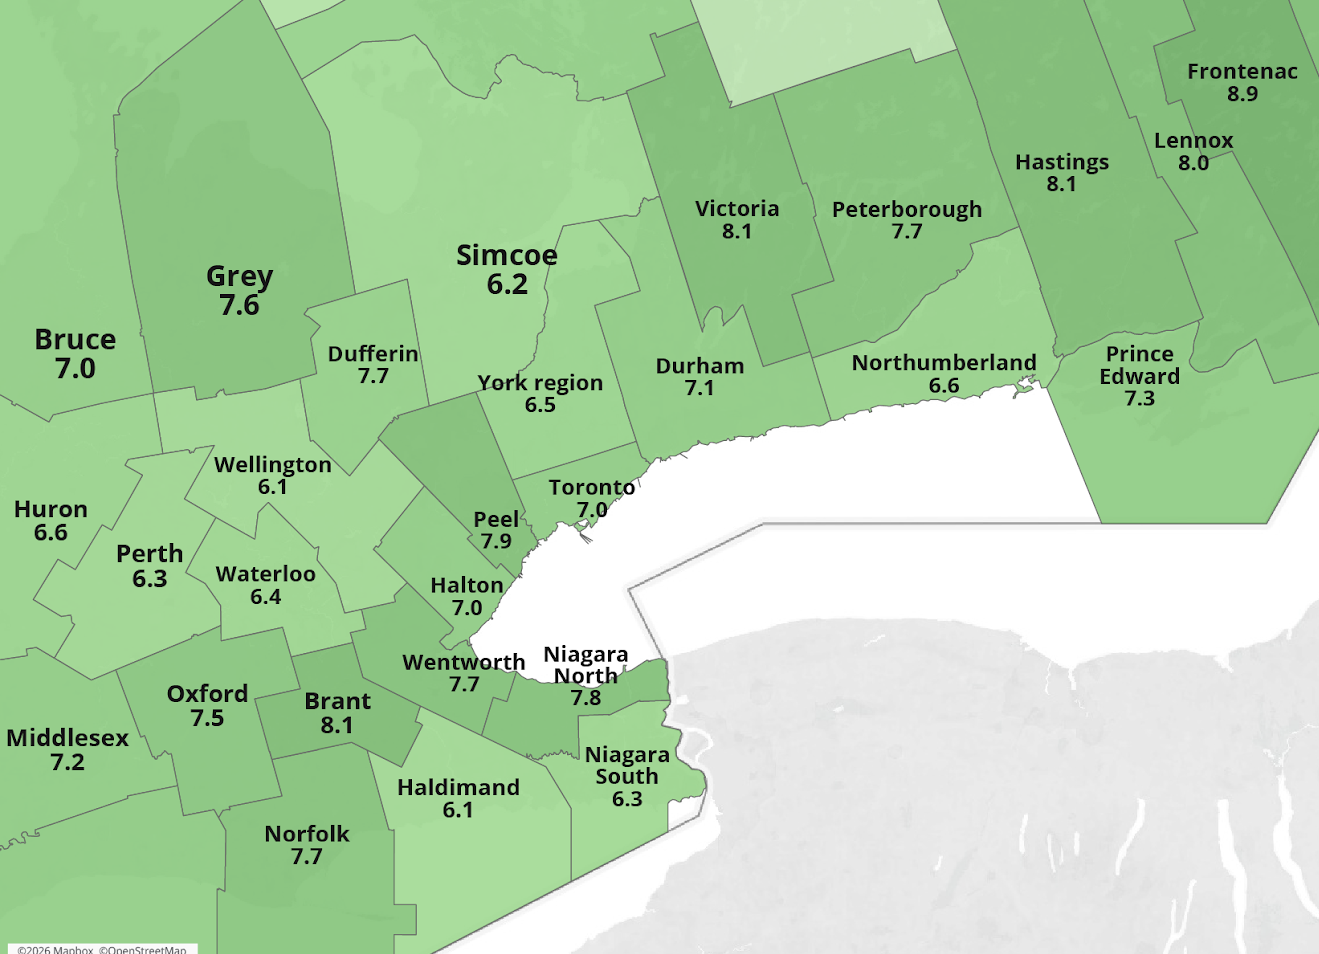
Next, we’ll look at how average holding periods vary by region, and how that pattern differs between condos and non‑condo properties across Ontario.
For condos, holding periods are generally shorter and more concentrated in the 6-to-8-year range, particularly across the GTHA and surrounding regions. This reflects higher turnover and greater mobility in urban and condo‑heavy markets, especially where condos serve as entry‑level housing.
In contrast, non‑condo properties are held much longer, often 10 to 15 years, with the longest holding periods concentrated in the GTA, surrounding commuter regions, and more rural markets. Toronto stands out with especially long non‑condo holding periods, underscoring the replacement cost and affordability barriers facing homeowners.
Overall, these maps highlight that ownership duration increases as properties become more expensive or harder to replace, reinforcing the idea that affordability pressures are contributing to longer holding behaviour and reduced housing turnover.
The average Toronto non-condo holding period was 15.6 years in 2025.
| wdt_ID | wdt_created_by | wdt_created_at | wdt_last_edited_by | wdt_last_edited_at | Year of Registration Date | 2025 | 2024 | 2023 | 2022 | 2021 | 2020 | 2019 | 2018 |
|---|---|---|---|---|---|---|---|---|---|---|---|---|---|
| 1 | soliver | 10/05/2026 06:01 PM | soliver | 10/05/2026 06:01 PM | 2,025 | 16.1% | 19.2% | 24.6% | 36.6% | 21.9% | 5.0% | 2.9% | 2.3% |
| 2 | soliver | 10/05/2026 06:01 PM | soliver | 10/05/2026 06:01 PM | 2,024 | 9.2% | 12.5% | 25.6% | 13.0% | 2.8% | 1.8% | 1.1% | |
| 3 | soliver | 10/05/2026 06:01 PM | soliver | 10/05/2026 06:01 PM | 2,023 | 5.5% | 17.6% | 8.3% | 1.7% | 1.2% | 1.3% | ||
| 4 | soliver | 10/05/2026 06:01 PM | soliver | 10/05/2026 06:01 PM | 2,022 | 9.6% | 2.8% | 1.3% | 0.9% | 1.3% | |||
| 5 | soliver | 10/05/2026 06:01 PM | soliver | 10/05/2026 06:01 PM | 2,021 | 3.0% | 1.5% | 1.2% | 1.1% | ||||
| 6 | soliver | 10/05/2026 06:01 PM | soliver | 10/05/2026 06:01 PM | 2,020 | 2.9% | 2.4% | 2.5% | |||||
| 7 | soliver | 10/05/2026 06:01 PM | soliver | 10/05/2026 06:01 PM | 2,019 | 4.3% | 4.0% | ||||||
| 8 | soliver | 10/05/2026 06:01 PM | soliver | 10/05/2026 06:01 PM | 2,018 | 3.6% |
In 2025, the share of properties sold at a loss increased, pointing to the growing impact of declining prices across parts of Ontario’s resale market. While overall volumes of properties sold at a loss remain modest, this uptick is an important signal of shifting market fundamentals.
The pattern is clearest among properties purchased during the pandemic peak, especially in 2022, which have since been resold in 2025. These transactions show the highest rate of losses with just over 36%, largely reflecting price corrections from those elevated entry points and the increased cost of carrying higher mortgage rates.
36.6% of properties purchased in 2022 were sold in 2025 at a loss.
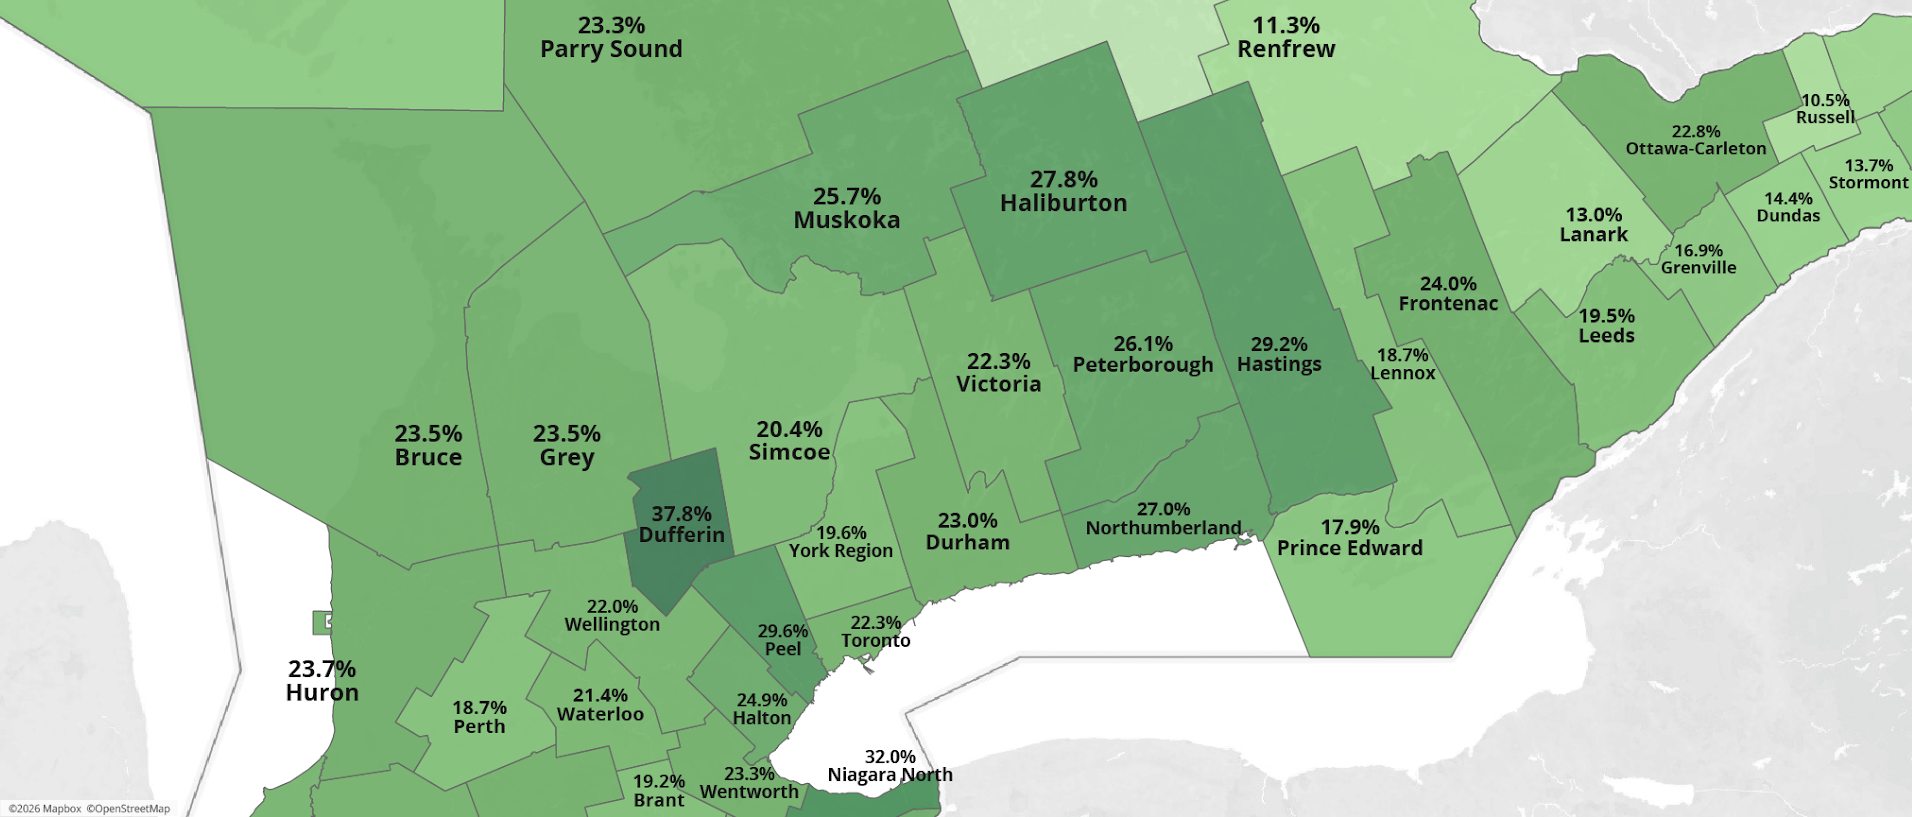
If we look at rates of loss from a regional perspective, we can see that Toronto and most surrounding regions saw over 20% of properties that were purchased in the years 2022 and 2023 and sold subsequently registered a loss. In the GTA, Peel had the highest rates of loss at 29.6%, which is a significant increase from 22% in 2024. Many of the “cottage country” regions north of the GTA experienced rates of loss in excess of 25%.
| wdt_ID | wdt_created_by | wdt_created_at | wdt_last_edited_by | wdt_last_edited_at | Recent Sold Amount Range | Year of Registration Date | 2025 | 2024 | 2023 | 2022 | 2021 | 2020 | 2019 | 2018 |
|---|---|---|---|---|---|---|---|---|---|---|---|---|---|---|
| 1 | soliver | 10/05/2026 06:44 PM | soliver | 10/05/2026 06:44 PM | 500K - 1M | 2,025 | 13.4% | 18.4% | 25.2% | 37.9% | 23.2% | 4.0% | 2.4% | 1.6% |
| 2 | soliver | 10/05/2026 06:44 PM | soliver | 10/05/2026 06:44 PM | 2,024 | 7.8% | 11.9% | 25.6% | 13.4% | 2.6% | 1.0% | 0.4% | ||
| 3 | soliver | 10/05/2026 06:44 PM | soliver | 10/05/2026 06:44 PM | 2,023 | 4.5% | 16.8% | 7.7% | 1.1% | 0.3% | 0.3% | |||
| 4 | soliver | 10/05/2026 06:44 PM | soliver | 10/05/2026 06:44 PM | 2,022 | 9.8% | 2.2% | 0.6% | 0.2% | 0.2% | ||||
| 5 | soliver | 10/05/2026 06:44 PM | soliver | 10/05/2026 06:44 PM | 2,021 | 2.0% | 0.6% | 0.3% | 0.4% | |||||
| 6 | soliver | 10/05/2026 06:44 PM | soliver | 10/05/2026 06:44 PM | 2,020 | 1.6% | 1.0% | 1.3% | ||||||
| 7 | soliver | 10/05/2026 06:44 PM | soliver | 10/05/2026 06:44 PM | 2,019 | 2.6% | 3.3% | |||||||
| 8 | soliver | 10/05/2026 06:44 PM | soliver | 10/05/2026 06:44 PM | 2,018 | 2.4% | ||||||||
| 9 | soliver | 10/05/2026 06:44 PM | soliver | 10/05/2026 06:44 PM | 1M - 3M | 2,025 | 16.7% | 17.0% | 20.8% | 33.7% | 17.6% | 2.4% | 1.2% | 1.4% |
| 10 | soliver | 10/05/2026 06:44 PM | soliver | 10/05/2026 06:44 PM | 2,024 | 9.8% | 9.8% | 21.4% | 10.2% | 1.2% | 0.9% | 0.4% | ||
| 11 | soliver | 10/05/2026 06:44 PM | soliver | 10/05/2026 06:44 PM | 2,023 | 4.2% | 16.1% | 5.4% | 0.9% | 0.5% | 0.4% | |||
| 12 | soliver | 10/05/2026 06:44 PM | soliver | 10/05/2026 06:44 PM | 2,022 | 9.0% | 1.5% | 0.2% | 0.3% | 0.2% | ||||
| 13 | soliver | 10/05/2026 06:44 PM | soliver | 10/05/2026 06:44 PM | 2,021 | 2.3% | 0.9% | 0.7% | 1.0% | |||||
| 14 | soliver | 10/05/2026 06:44 PM | soliver | 10/05/2026 06:44 PM | 2,020 | 5.6% | 3.2% | 4.3% | ||||||
| 15 | soliver | 10/05/2026 06:44 PM | soliver | 10/05/2026 06:44 PM | 2,019 | 9.8% | 5.6% | |||||||
| 16 | soliver | 10/05/2026 06:44 PM | soliver | 10/05/2026 06:44 PM | 2,018 | 5.0% | ||||||||
| 17 | soliver | 10/05/2026 06:44 PM | soliver | 10/05/2026 06:44 PM | 3M - 5M | 2,025 | 50.0% | 9.1% | 11.5% | 27.4% | 9.1% | 2.2% | 0.0% | 1.9% |
| 18 | soliver | 10/05/2026 06:44 PM | soliver | 10/05/2026 06:44 PM | 2,024 | 14.3% | 28.6% | 15.0% | 3.6% | 3.1% | 0.0% | 1.7% | ||
| 19 | soliver | 10/05/2026 06:44 PM | soliver | 10/05/2026 06:44 PM | 2,023 | 33.3% | 34.5% | 9.3% | 1.0% | 1.2% | 0.0% | |||
| 20 | soliver | 10/05/2026 06:44 PM | soliver | 10/05/2026 06:44 PM | 2,022 | 35.3% | 3.0% | 0.7% | 1.0% | 1.4% | ||||
| 21 | soliver | 10/05/2026 06:44 PM | soliver | 10/05/2026 06:44 PM | 2,021 | 4.8% | 0.0% | 2.0% | 1.5% | |||||
| 22 | soliver | 10/05/2026 06:44 PM | soliver | 10/05/2026 06:44 PM | 2,020 | 37.5% | 8.1% | 3.4% | ||||||
| 23 | soliver | 10/05/2026 06:44 PM | soliver | 10/05/2026 06:44 PM | 2,019 | 0.0% | 5.3% | |||||||
| 24 | soliver | 10/05/2026 06:44 PM | soliver | 10/05/2026 06:44 PM | 2,018 | 0.0% |
To dig even deeper into this trend, we can look at whether certain value ranges of properties were more prone to selling at a loss than others. Properties across all value ranges purchased in 2022 and sold in subsequently show elevated rates of loss. This trend is particularly prominent when we look at properties purchased in 2022 and resold in 2025 in the sub-$1M segment. 40% of these properties sold at a loss, highlighting significant risk in the most affordable price tier.
The $1M to $3M price tiers, which represents the most active portion of the market, also recorded a high loss rate of 34%, indicating that loss exposure is not only limited to entry-level properties but extends to other core markets segments.
37.5% of properties valued at $3M to $5M purchased in 2020 sold at a loss in 2020.
Conclusion
Overall, this report highlights that Ontario’s housing market is entering a new phase; one defined less by traditional price cycles and more by behaviour. Over the past few years, buyers and sellers have adjusted to affordability challenges and broader economic uncertainty. This has created a market that is selective, but not inactive.
Multi‑property owners remain part of the landscape but with more discipline, leaner portfolios and an increased focus on asset quality. First‑time homebuyers will continue to enter the market later and concentrate in specific regions where affordability aligns.
Teranet’s Data Analytics team will continue to monitor these trends and the behaviours of Ontario’s buyers and sellers to bring you new insights in future editions of the Market Insight Report.
If you need more information about the data presented in this report, the Teranet Data Science Lab can help you dig deeper. Our team will work closely with you to answer your questions with insights from our proprietary databases.
Connect with a Teranet account manager if you’d like to learn more.
Want to receive Teranet’s data spotlights and market insights regulary?
Sign up to be notified as soon as they’re released.