An Overview of Ontario's Housing Market in 2024


Ontario’s real estate market has recently experienced a few tumultuous years in a row. In particular, the easing of interest rates did not bring about the market recovery that was anticipated by many. While we continue to expect a lot of uncertainty in the coming years, Teranet is in the position to share insights that we have gleaned from studying Ontario’s Land Registry data to bring clarity to real estate market trends during these challenging times.
In this edition of the Market Insight Report we will focus on transfer registrations, which cover all changes in ownership that are conferred in Ontario’s Land Registry. The report will cover both purchase and sale transactions, as well as off-market transactions that likely involve related parties. Any regional data referenced in the report is based on the geographic boundaries of the Land Registry Offices in Ontario, which loosely correspond with major municipalities and regions in the province.
Transfer volume overview
 Dive Deeper Into the Data
 In this initial section of the report we will review Ontario transfer volumes at a high level. Over the past decade, 2023 had the lowest transaction rates, and 2024 only improved marginally. (Figure 1A). In the last ten years, the Ontario market very consistently had 75% of transfers coming from non-condo properties and only 25% from condo properties. When looking at the year-over-year change (Figure 1B) the two property types trend fairly closely together, however a divergence appeared in 2024 when there was a 10% lift in condo properties, while non-condo property transactions were flat.
The split between transfers of condo and non-condo properties has been fairly stable over the past 10 years, but 2024 saw a peak of over 27% for condo transactions.
When we look at the same set of data with a particular focus on Toronto, a slightly different story emerges. Toronto’s market differs from Ontario’s in the breakdown of property transfers, as 60% of the Toronto transfers come from condo properties and only 40% come from non-condo properties. There have also been multiple years with a divergence of the year-over-year change of the two property types in Toronto that isn’t seen in Ontario’s market as a whole. In 2024, Toronto condos experienced a fairly large lift of 20% year-over-year, while the non-condo space had a marginal increase of 4%, which seems to contrast news headlines suggesting a deterioration in the Toronto condo market.
Toronto condo transfers have remained fairly stable at around 60% in the past 10 years but peaked at over 65% of transfers in 2024.
To further explore the discrepancy between our data and news headlines, we segmented Toronto condo transfers into resales and new builds. In 2024, resale activity was at the lowest level seen in the past 10 years, which correlates to what has been reported in the market (Figure 3A). However, new build condo transfer volumes were 78% higher in 2024 compared to 2023 (Figure 3B). It is important to note that Ontario’s Land Registry data recognizes new builds only when the unit is ready for occupancy, even if it was pre-sold years before. This flood of about 15,000 new condo properties that became available in 2024 was an important piece of data in order to fully understand the condo market and perhaps contributed to the low volume of resale in the year.
In 2024, new builds ready for occupancy almost doubled, while resale volumes were at their lowest level in 10 years.
Power of Sale Trends
Another broad trend we continue to monitor closely is power of sale transfers as this is an indicator of homeowner stress when they are unable to make mortgage payments. When we analyze the ten-year history of volume it is clear the 2024 levels are still low historically compared to other years such as 2015 and 2016 (Figure 4A). However, there was a noticeable uptick in the volume of power of sales since 2022.
If we look at this trend from a regional perspective, it appears that certain regions are more vulnerable than others. Figure 4B highlights that 13% of all power of sales came from Toronto, 9% from Peel and 6% from Simcoe. However, some regions have a higher concentration of power of sales than others. For example, Peel had 9% of the power of sale transfers in 2024, but overall it contributed to only 7% of total transfer volume. Middlesex had a similar pattern as they had 6% of power of sale transfers but only 3% of overall transfer volume. Some regions, such as Halton and Waterloo, are less vulnerable to power of sale transfers and therefore, don’t appear individually in Figure 4B, proving that there is regional divergence in terms of where power of sale tends to occur that is not proportionate with overall transfer volume.
Overview of Ontario buyer segments
In exploring trends by buyer segment, Teranet classifies buyers into the following categories:
- Movers: This category of buyers moved from one property in Ontario to another. They have sold their sole, existing property and purchased another property within a period of time.
- Multi-property owners: Property purchases by buyers who, at the time of the purchase, also own other properties in Ontario. The properties purchased by this group of buyers could represent a principal residence, an investment property, or a recreation property.
- First-time homebuyers: Property purchases by buyers who claimed the Ontario land transfer tax exemption for first-time homebuyers. To qualify for this exemption, the buyer(s) must not have purchased property anywhere in the world.
- Life event: Transfer of ownership between related parties for nominal value. These transactions could be due to marriage, divorce, or transfer between generations.
- Other: All other buyers. This could include buyers from outside of Ontario or Canada, or re-entry into the property market after an extended absence.
We will start this section of the report by looking at how each of the buyer segments in Ontario participate in the market and what share they have of the total market (Figure 5). Multi-property owners’ share of transfer volumes in Ontario has increased over time, and for the last couple of years they have been the biggest segment, representing about a quarter of all transfers.
First-time homebuyers have always been a stable and strong segment, consistently accounting for 20% to 25% of the transfer volume in Ontario. Recently, their share of the market dipped in 2022 after interest rates started to increase, but has since recovered with the recent rate cuts.
In absolute terms, life event transactions have remained fairly stable over time, but fluctuates as a share of volume due to prevailing market conditions. Over the past couple of years, overall transfer volumes have been low, which makes it appear that life events are taking up a larger share in the market.
The other segment has been in constant decline since 2011. This segment’s volumes dipped during the COVID-19 pandemic and have remained fairly flat into 2024.
Lastly, movers have historically been one of the smallest segments, although they do generate a large portion of news headlines. Activity among this segment has dipped since interest rates started to increase in 2022 and have yet to recover despite recent interest rate cuts. This suggests that the mover segment continue to stand on the sidelines until market conditions stabilize.
The market share of multi-property owners has declined since the peak in 2022, but this segment still remains the largest group of buyers.
When we review transfer volumes by buyer segments in relation to property types, it appears that there is a preference for condo versus non-condo properties by certain segments. Condo transfers are dominated by multi-property owners (Figure 6A), and in 2024, this segment purchased one in three condos in Ontario. First-time homebuyers account for about a quarter of the condo market, which speaks to the relative affordability of condo versus non-condo properties in Ontario. Movers on the other hand, have low participation in the condo market.
Transfer volumes of non-condo properties are much more balanced among all buyer segments (Figure 6B), and movers account for more volume in this market compared to the condo space.
Multi-property owners account for one-third of Ontario condo market activities.
Regional spotlights
Toronto: Urban Centre
Over the past five years, almost 30% of transactions in Toronto were made by multi-property owners, followed by first-time homebuyers which account for just over a quarter of the overall volume. While Toronto still remains an attractive market for these two segments, there is very little activity made by movers in the city.
Peel and York Regions: Suburbs
While Peel and York are both classified as suburban, they show a difference in trends amongst buyer segments. York is very much dominated by transactions from multi-property owners, while volume is much lower amongst first-time homebuyers. Peel is a slightly different story, where first-time homebuyers represent the dominant buying cohort. Peel also remains attractive to multi-property owners who made up just under 25% of total transfer volume from 2020 to 2024.
Middlesex (London): University Town
Moving outside of the GTA, we observe that Middlesex was historically a fairly well-balanced market among all buyer segments, however in the past 5 years, first-time homebuyers and multi-property owners have increased their transactions here to dominate the region’s market.
Muskoka: Cottage Country
Lastly, we will observe trends for Muskoka which has its own unique dynamic as a region known for its recreation properties.
Buyer segment volumes in Muskoka differ from the other regions analyzed in this section, as life event is the biggest segment. This trend is intuitive based on the knowledge that a lot of cottage properties are passed down through generations, and represents a third of the transfer in this region over the past 5 years. Muskoka also has a high volume of multi-property owner transfers, which suggests that buyers are purchasing a recreation or investment property. An interesting trend is the size of the other segment in Muskoka which may represent buyers from outside Ontario or Canada investing in recreation properties in this region.
The escalation of home prices in Ontario over the past few years is well-known and has tested the spending limits of each Ontario buyer segment differently. In 2011, all buyer segments were spending within a very tight price band with first-time homebuyers spending roughly $300,000 on average at the lower end of the band and movers spending on average $420,000 at the top of the band (Figure 8A). Over time, while first-time homebuyers have remained at the bottom of the band and movers have stayed at the top, the gap has widened significantly. Movers reached their peak average purchase price of just over $1 million in 2022, which in 2024 had declined 10% to $930,000. These increases over time are very significant as the compound annual growth rate (CAGR) of Ontario movers was about 6.4% and 6.6% for first-time homebuyers.
We observe a slightly different pattern as we analyze the data specific to Toronto non-condos (Figure 8B). The multi-property owner, other and mover segments are all spending in the same price range and over time have escalated at the same rate. First-time homebuyers on the other hand are still spending the least with less purchasing power. In comparison, in 2011, first-time homebuyers were spending on average about $500,000 which increased to $1.3 million in 2024, while movers saw an increase of over $1 million from $730,000 in 2011 to $1.75 million in 2024. These escalations represent a CAGR of 6.9% for movers and 7.6% for first-time homebuyers.
In Ontario, the mover segment historically spent the most on property purchases.
Buyer segment spotlight: Multi-property owners
As mentioned earlier in this report, multi-property owners are the largest buyer segment in Ontario and we’ll dig a bit deeper into their activity in this section. Figure 9 outlines the number of properties held in the portfolios of multi-property owners. As of December 31, 2024, 55% of multi-property owners have two properties, followed by 20% who have three properties, which suggests that the vast majority of multi-property owners are “passive” owners as opposed to those who are leveraging their real estate portfolio for active income. Only 7.2% of multi-property owners own 11 or more properties, which has declined from 13% in April 2022, suggesting active reduction in portfolio sizes since the series of interest rate increases that began in early 2022.
Multi-property owner portfolio holdings have shrunk across the board since April 2022.


To further analyze multi-property owners in Ontario, we segmented Toronto condos these buyers into two sub-groups: new and existing. Existing multi-property owners transactions are purchases by those who already owned more than one property, while new multi-property owners are transactions by those where the purchase represented their second property.
Over the past ten years, new multi-property owner purchases account for 70% of all multi-property owner transfer activity, with only 30% coming from existing multi-property owners, which indicates that new buyers are flooding the market to acquire additional properties.
Both existing and new multi-property owners experienced significant growth in Toronto in 2024 with 38% and 22% respectively (Figures 10A and 10B). A distant second in terms of the number of transactions was York Region, although this region experienced a decline year-over-year from 2023 to 2024. The next two largest markets for multi-property owners were Peel and Halton which both experienced growth in 2024. Wentworth and Waterloo both experienced significant year-over-year declines from 2023 to 2024 amongst multi-property owners.
Over the past ten years, new multi-property owner purchases accounted for 70% of all multi-property owner transfer volumes.
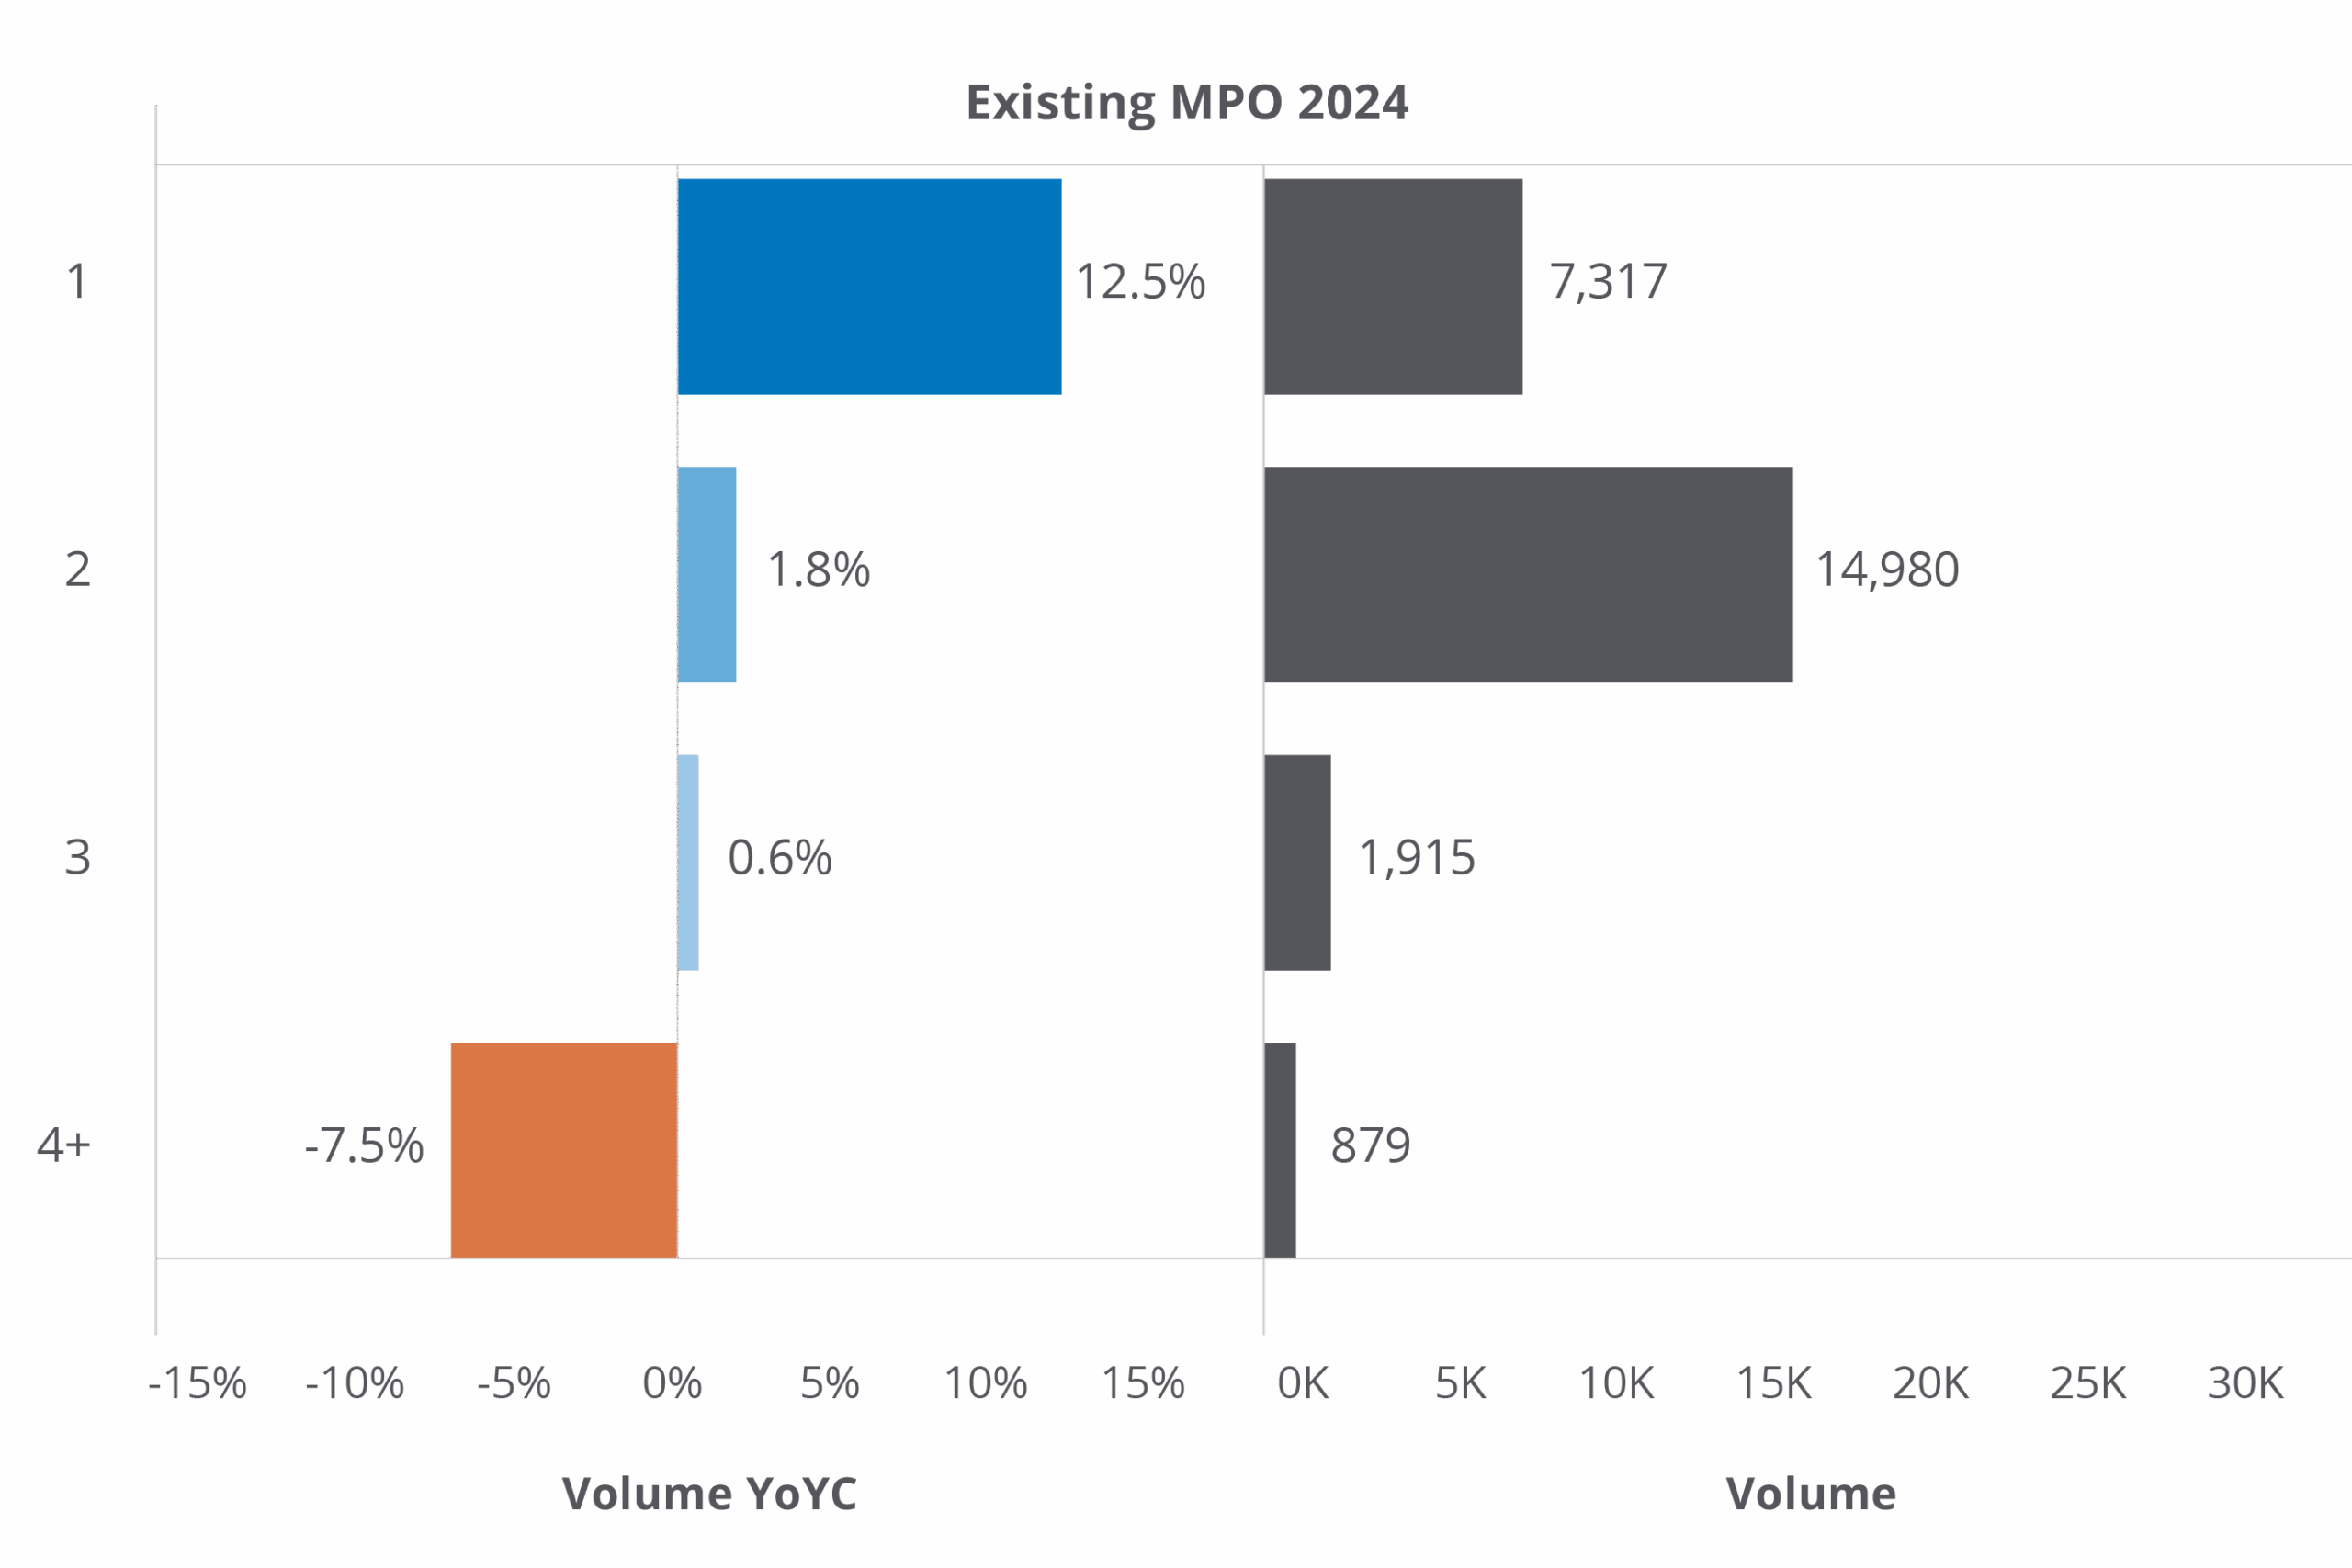

When analyzing the multi-property owner segment, we wanted to further profile this buyer type by analyzing whether they are purchasing in groups or on their own. As would be expected, the majority of multi-property owner purchases are made with two parties, whether they are new or existing MPOs (Figures 11A and 11B). To note, Teranet had previously studied the ages of these purchasing groups and found that the ages of the buyers in a two-party group are quite close together, indicating that these are not purchasing groups spanning multi-generations but are likely couples purchasing together.
Surprisingly, the second biggest group of multi-property owners are those purchasing properties on their own. In 2024, both existing and new multi-property owners purchasing solo experienced significant year over year growth of 12.5% and 5.4%, respectively.
There is an emerging group of single-party multi-property owners that account for 20% of all multi-property purchases.
Profile of a new, single-party MPO in 2024
To better understand these solo multi-property owners against the backdrop of a tumultuous Ontario market in 2024, we developed a profile based on the property type, regional preference, financing preference and generation of these buyers. There doesn’t appear to be a preference for property type as these single-party multi-property owners bought an equal proportion of condo and non-condo properties (Figure 12A). 31% of these buyers chose Toronto, followed by 13% in York and then 7% in Peel (Figure 12B). Interestingly, 30% of purchases made by single-party multi-property owners were done without a mortgage, which are rates higher than the overall Ontario market (Figure 12C). Additionally, the majority of these buyers, about 39%, are millennials, followed by Gen-X with 36% (Figure 12D).
Buyer segment spotlight: First-time homebuyers
Next, we will dig deeper into the first-time homebuyer segment. Our analysis for this group will focus on the average age of a first-time homebuyer, which helps us understand the life phase when Ontarians enter the housing market. Figures 13A, 13B and 13C show the distribution of the average ages of first-time homebuyers when they make their first purchase in 3 distinct periods in time for comparison purposes. In 2014, the median age of a first-time homebuyer was 36, which increased to 38 within five years. This buyer segment is getting older and waiting longer to enter the Ontario real estate market as the average age of a first-time homebuyer increased to 40 in 2024. This observation is testament to the likely effects of the affordability challenges in the Ontario housing market.
Buyer segment spotlight: Movers
Movers are historically the smallest buyer segment in Ontario, yet they have received a lot of media attention since the start of the COVID-19 pandemic. In tracing where movers are coming from and going to, we observe that the largest moving pattern in Ontario are those that moved within the same city they currently own property. About 70% of all movers belong to this group, however this has been shrinking over time.
The second largest group within this segment are those moving from outside of the GTA to another area outside the GTA. This group has doubled in volume in the last ten years which may be reflective of where housing supply is increasingly available.
The next group are those that are moving from the GTA to outside of the GTA. While this was a topic that was heavily reported on during the COVID-19 pandemic and there indeed was a slight uptick in volume from 2021 to 2022, this group remains one of the smaller mover segments.
Movers going from one part of the GTA to another part of the GTA are another small group and have continued to shrink in recent years.
The smallest group are those moving from outside the GTA into the GTA with about 3% of the total mover volume. While some post-pandemic headlines report anecdotal occurrences of migration back into the city from those who moved away during the pandemic, we didn’t observe much variation in the trendline since the volumes were low to begin with.
Overview of Ontario sellers

In this section of the report we will focus on trends amongst sellers in Ontario. The first area of analysis we will focus on is turnover rate, which we measure through holding periods. Longer holding periods will lead to lower turnover of the housing stock and transactions overall. Teranet calculates holding period at the time of a sale and look back to see how long the homeowner held onto their property up to the point of sale. A trend has clearly emerged as we observe holding periods increase for all property types over time, but especially in the last three years. In 2015 the average holding period for condo properties was just under seven years (Figure 15A), but by the end of 2024 this had increased to over eight years. The average holding period for non-condos in 2015 was 11 years with an increase to 12.5 years at the end of 2024. The Toronto non-condo market is particularly interesting as the average holding period for these properties in 2015 was 13.8 years, but by the end of 2024 this had increased to 17.8 years.
When looking at the average holding period by region from 2015 to 2024, Toronto is one of the longest in Ontario (Figure 15B), while areas surrounding Toronto such as York and Peel are shorter. This data seem to correlate with the idea that due to the lack of affordability in Toronto, many choose to renovate their existing property as opposed to moving to a new one within the same area to meet their evolving housing needs.
Toronto’s holding period is one of the longest in Ontario.
| Sold Year | Purchase Year | ||||
| 2024 | 2023 | 2022 | 2021 | 2020 | |
| 2024 | 9.5% | 12.7% | 25.9% | 13.0% | 2.8% |
| 2023 | | 5.5% | 17.6% | 8.2% | 1.7% |
| 2022 | | | 9.5% | 2.7% | 1.3% |
| 2021 | | | | 3.0% | 1.5% |
| 2020 | | | | | 2.8% |
In these tumultuous market conditions such as those we experienced during the pandemic to now, we analyze properties that sold at loss to evaluate homeowner stress. Historically, the rate of loss in Ontario has been between 2% and 4%. However, properties that were purchased since 2022 and sold subsequently are showing very high rates of loss; One in four properties purchased in 2022 and sold in 2024 were sold at a loss.
Properties purchased during the pandemic peak are experiencing elevated rates of loss compared to historical levels.

In analyzing rates of loss from a regional perspective, we observe that Toronto fared better than most other Ontario regions but still saw that 15.8% of properties that were purchased in the years 2022 and 2023 and sold subsequently registered a loss. In the GTA, Peel had the highest rates of loss at 22%. Many of the “cottage country” regions north of the GTA experienced rates of loss in excess of 20%. Across Ontario, the median loss for properties purchased in 2022 and 2023 and then sold subsequently was $45,000. In the GTA the median loss was even higher at $56,000. Muskoka experienced a significant median loss of $240,000, however, the volume of transactions was relatively low.
Regions classified as cottage country, Dufferin, Peel and Niagara North had the highest rates of loss.
Selling at a loss - Value Range
| Value Range | Sold Year | Purchase Year | ||||
| 2024 | 2023 | 2022 | 2021 | 2020 | ||
| 500K-1M | 2024 | 8.1% | 12.1% | 25.9% | 13.4% | 2.6% |
| | 2023 | | 4.5% | 16.8% | 7.7% | 1.1% |
| | 2022 | | | 9.8% | 2.2% | 0.6% |
| | 2021 | | | | 2.0% | 0.7% |
| | 2020 | | | | | 1.6% |
| 1M-3M | 2024 | 10.3% | 10.2% | 21.7% | 10.3% | 1.2% |
| | 2023 | | 4.2% | 16.0% | 5.4% | 0.9% |
| | 2022 | | | 8.9% | 1.5% | 0.2% |
| | 2021 | | | | 2.3% | 0.9% |
| | 2020 | | | | | 5.3% |
| 3M-5M | 2024 | 14.3% | 28.6% | 15.2% | 4.5% | 3.1% |
| | 2023 | | 33.3% | 33.9% | 9.2% | 1.0% |
| | 2022 | | | 35.3% | 3.0% | 0.7% |
| | 2021 | | | | 4.5% | 0.0% |
| | 2020 | | | | | 37.5% |
To dig even deeper into this trend we analyzed whether certain value ranges of properties were more prone to selling at a loss than others. Properties across all value ranges purchased in 2022 and sold subsequently show elevated rates of loss, in particular those in the $3 million to $5 million range, although the volume of transactions in this category was relatively low. However, the smaller value range was not immune to loss as one in four properties valued between $500,000 and $1 million that were purchased in 2022 and sold in 2024 sold at a loss.
1 in 4 properties purchased in 2022 and sold in 2024 worth under $1 million suffered a loss
Conclusion
In summary, we discern the following trends in the Ontario housing market using data up to December 31, 2024:
- Multi-property owners continue to be the dominant purchasing segment in Ontario, accounting for a quarter of transactions.
- A new group of single-party multi-property owners with financial resources has emerged in the market and defied Ontario’s challenging market conditions.
- Those who purchased in late 2021 and 2022 and sold subsequently are doing so at a loss and at elevated rates against historical trends.
- First-time homebuyers faced tremendous headwinds when entering the market, especially those looking to purchase a non-condo property in Toronto. This is likely correlated with the increase in the average age of first-time homebuyers getting into the market.
We will continue to monitor the market against recent mortgage policy changes, the interest rate landscape, upcoming mortgage renewal cycles and macroeconomic developments.
If you need more information about the data presented in this report, the Teranet Data Science Lab can help you dig deeper. Our team will work closely with you to answer your questions with insights from our proprietary databases.
Connect with a Teranet account manager if you’d like to learn more.
Want to receive Teranet’s data spotlights and market insights regulary?
Sign up to be notified as soon as they’re released